AI-Generated Market Data Analytics: The View From Higher Up the Stack
Our last post covered the bits and bytes — getting Claude to write a verified NASDAQ ITCH decoder from a protocol spec, straight out to Parquet. Thinking about the next levels up the stack; once the Parquet file exists, what does it take to actually look at the data, ask it questions, and derive real value from the data? As someone that has only basic SQL skills, I also turned to Claude Code for the process, but with a slightly different flavour of "human in the loop."
Same file, no pipeline, and it travels well
The dashboards in this post query the Parquet file directly. No warehouse, no ingestion job, no ETL step in between — Grafana talks straight to DuckDB, DuckDB reads the Parquet in place. That's a nice trick on its own, but it's not just a shortcut for a demo.
Parquet's columnar layout compresses well with zstd. That means an FMADIO appliance sitting in a colo or at an exchange can do its own near-real-time local analysis directly off the raw file on fast local storage, and separately ship a heavily compressed copy back to a central location — for archival, or further analysis down the line. The same file format doing both jobs, with nothing extra to build.
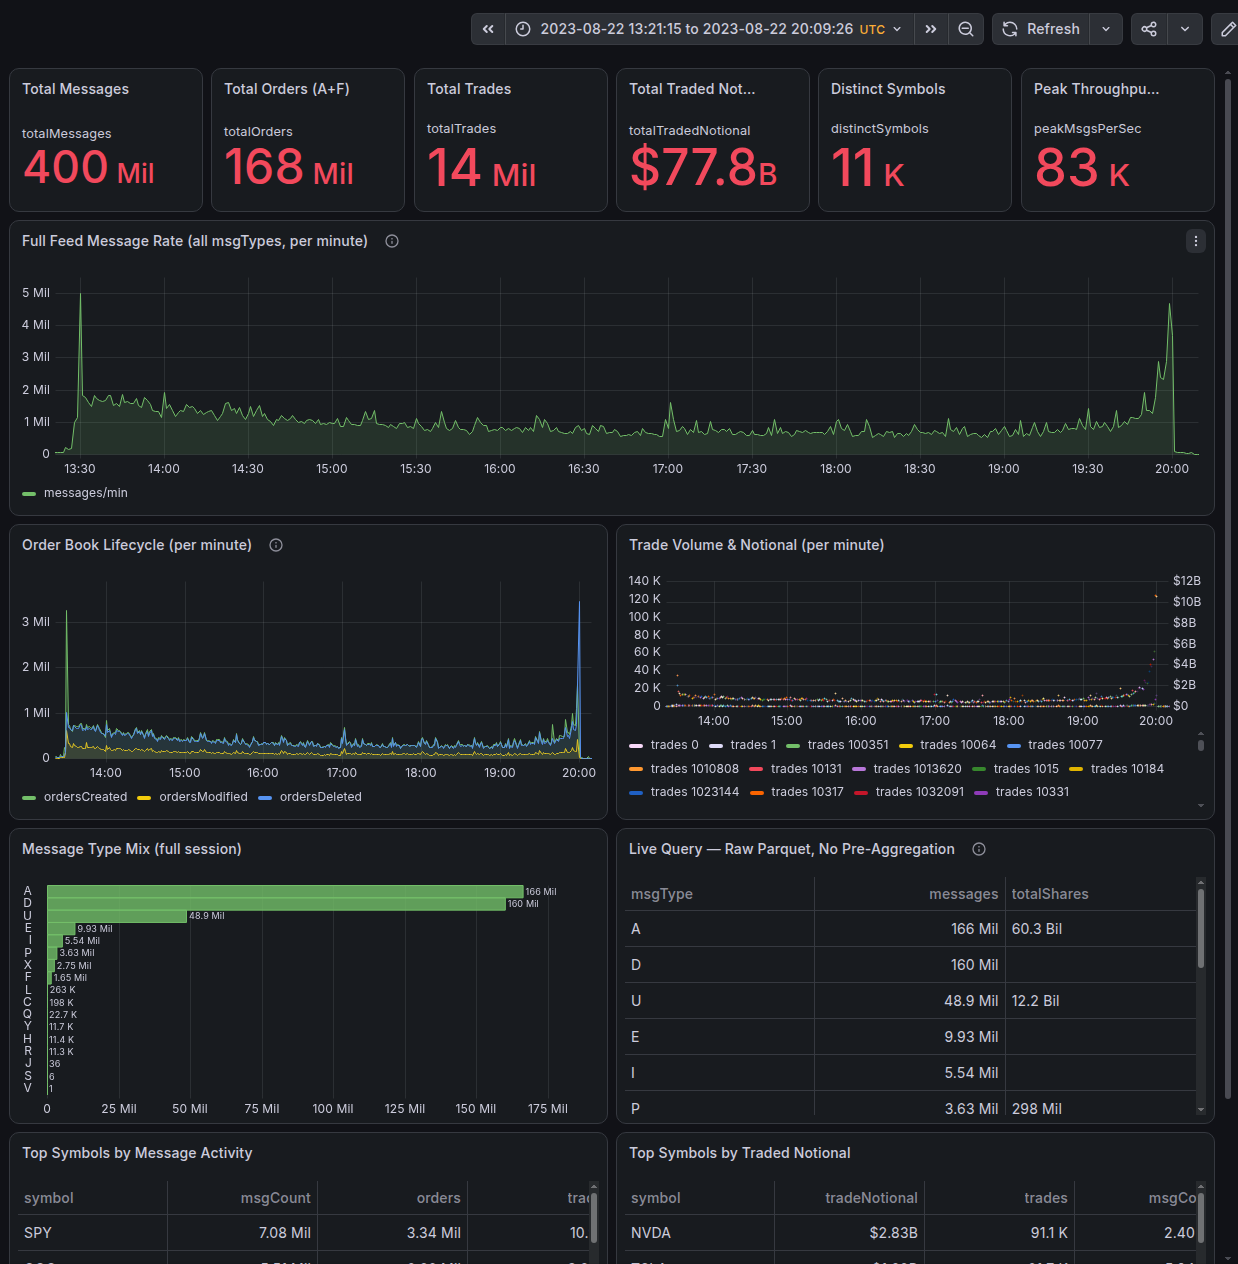
ITCH Message Summary dashboard
That's the whole session — 400 million messages, 168 million orders, 14 million trades, $77.8B traded notional across 11,000 symbols — queried straight off the source Parquet file, no pre-loaded warehouse in sight. The message-rate chart shows exactly what you'd expect from a real trading session: a sharp spike at the open, a quiet grind through the middle of the day, and another spike into the close, peaking at 83,000 messages a second.
I don't write SQL. Claude does.
Here's the part I actually want to emphasise, because it's the more interesting story than the architecture. I'm not an engineer — I described what I wanted to see, in plain language, and Claude wrote the queries. Bid-ask spread over time. Order book activity per symbol. A candlestick panel with volume. A leaderboard of the largest prints by notional. I didn't write or debug the SQL myself.
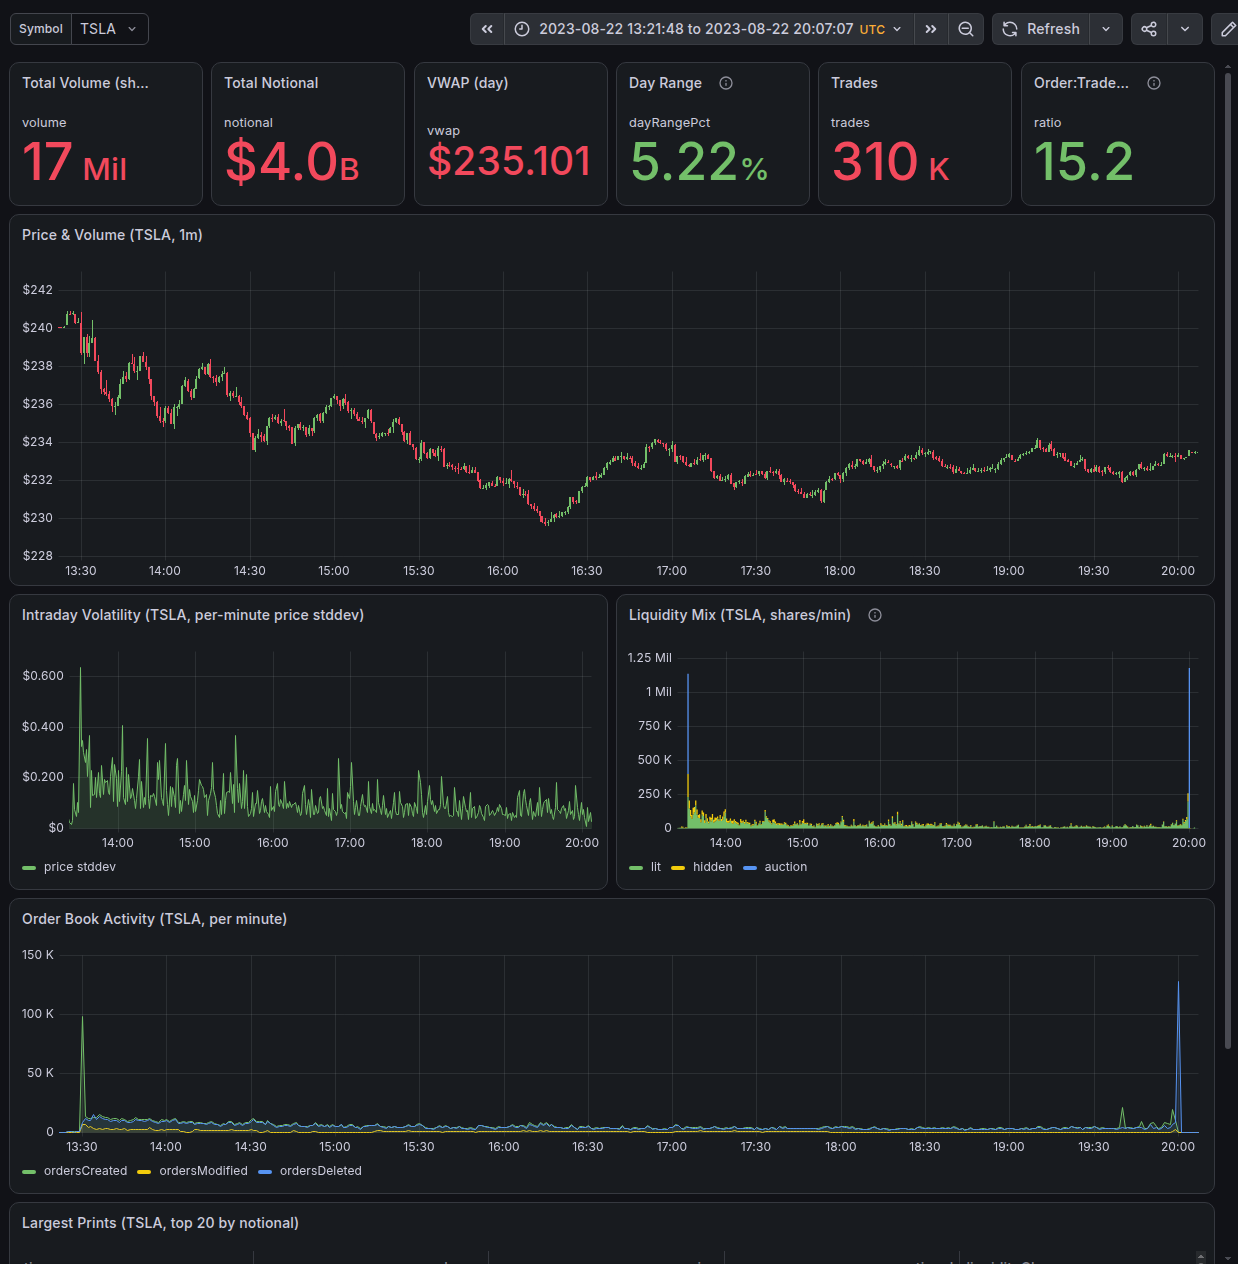
ITCH Symbol Drill-down Dashboard
Pick a symbol from the dropdown — TSLA, in this case — and the whole set of panels re-queries live: 17 million shares traded, $4.0B in notional, a VWAP of $235.10 on the day, price ranging 5.22% top to bottom, 310,000 trades against an order-to-trade ratio of over 15:1. The candlestick chart, the volatility panel, the liquidity mix (lit vs hidden vs auction volume) — I asked for each of these in a sentence or two, and Claude turned that into working SQL against the underlying tables.
This is a different workflow to Part 1 of this series. That showed AI grounding itself against a formal spec and reference data, mostly autonomously. This shows something more like what most people will actually do with this: a domain expert who knows what a market data session should look like, directing an AI that knows how to query it, entirely through description rather than code.
The gotchas: found by a human looking at a chart
The decoder workflow in Part 1 caught its own bugs against verified reference data. This is a more analogue workflow — I looked at a chart, something looked off, and I told Claude what I saw or pasted back whatever error Grafana threw. The human was the sensor; the LLM did the diagnosis. A few of those moments, in short:
A number that didn't add up. One of the summary stat panels was reporting a total that was obviously wrong at a glance. I described the discrepancy; Claude traced it to an integer overflow in an aggregation (HUGEINT territory) and fixed the cast, both in the table build and in the live query re-aggregating it.
A dashboard variable that broke every query using it. Switching the symbol dropdown threw a SQL parse error. I pasted the error text in; Claude worked out that the plugin already wraps template variables in quotes, so my dashboard queries quoting $symbol a second time were doubling up. Fix was to stop manually quoting it.
A rebuild that failed for no obvious reason. Refreshing the underlying data while Grafana was running threw a lock error. I sent the raw message over; Claude recognised it as DuckDB holding an exclusive file lock while the plugin had it open, and the fix was simply to stop the Grafana service before rebuilding.
None of these needed me to understand DuckDB internals or Grafana's plugin architecture. I just needed to notice something was wrong and describe it.
Where this goes
Part 1 showed a decoder built and verified in an afternoon for about $100. This is the next link in the same chain — the analytics layer on top of that output, built the same way, by someone who doesn't write SQL. Cheap decoders plus a directable analytics layer, on a storage format that already knows how to travel from a single capture point to a central archive with a simple copy command — that's the shape of the thing we're building toward for end users running capture across multiple venues.
Part 3 is on its way. The focus will be on Order Entry protocols, where the rubber really hits the road. Stay tuned.
Contact us for a further discussion https://www.fmad.io/contact-us