Ethernet Layer 1 Packet Capture

Its Broken
Every now and then there are “weird” errors that happen on a network. Sometimes it requires a link bounce, sometimes ports flap for unknown reasons and in other cases you get “errors” or complaints the link is down without much description beyond that. This is where FMADIO Layer 1 Capture really shines, literally it shines light (no phun) on what’s actually happening beyond the “it’s broken” kind of statement that is frequently heard.
XLGMII Debugging
XLGMII is the layer 1 protocol used on 40G ethernet, typically a 40G PCS is wired to a 40G PMA where that PMA is wired to an FPGA/ASIC transceiver. Note the term transceiver here refers to, for example, Xilinx GTY, GTYP, GTM serial transceivers, not the SFP, SFP28, QSFP, QSFP28 pluggable transceiver modules that would be commonly plugged into network switches.
A basic diagram of what that looks like is shown below:

XLGMII 40G Front End Pipeline
In the diagram, the Purple “Digital Tap” means that we are taking another copy of the XLGMII traffic and routing that to FMADIO Layer 1 problem diagnosis capture. It should be highlighted, this is all in parallel to the high speed FMADIO Packet Capture appliance running, and it will process all incoming packets (PCAP’s) but also layer 1 trace capability at the same time, in parallel, with no impact to the PCAP capture function. It does consume a little bit of FPGA resources but we believe this is LUTs well spent given the usefulness of this debug functionality.
FMADIO L1 Capture currently is available with the FMADIO 8 x 10Gbps packet capture images and FMADIO 2 x 40Gbps packet capture modes. The power of this is evident when something odd occurs in the regular PCAP data (e.g. FCS corruption). With a few tweaks to the device capturing corrupted packets, it can be configured to enable FMADIO L1 Capture and diagnose FCS or other corruption in parallel to PCAP generation.
This enables powerful additional network visibility in a production environment, with no additional hardware or software ware and with zero impact to the daily PCAP Packet Capture process.
Finger Pointing
One of the usual endless network problems is when Person/Company/Vendor/Client/Broker Mr. A claims X, while the other side of the network connection Person/Company/Vendor/Client/Broker Mr. B claims Y. This is usually around an Error counter incrementing on a Switch / NIC showing “something bad happened”, a link fails randomly or just “weirdness” on the network, we have all been there and then the finger pointing game begins.
Usually no one knows what has actually happened, nor anyone has real evidence of what’s going on. It’s all hearsay, “engineering says something”, “operations says something else”, chicken blood gets spilled, rain gods are called, everyone ends up pissed off and the problem is no closer to resolution.
Enter … FMADIO Layer 1 Capture.
Hunting FCS Corruption
While the FMADIO devices capture full packets including any FCS corrupted data, accessing layer 1 traces of this corruption can aid debugging of FPGA development, weirdness with switches or datacenter ghosts as it gives significantly better context around the problem and identifies the root cause.
In the following case we are arming the FMADIO L1 Capture to trigger / stop capturing when an FCS error is generated.

Basic FCS Corruption
In the above trace, highlighted in red, you can see our FCS signal is flagged “FCS:X” - Note that it is several cycles away from the end of the packet due to pipeline latency.
What’s interesting is you can see what is on the wire as a continuous byte stream. This gives context with the previous packet, the next packet, and inter-packet spacing. Perhaps we can call this nanoburst analysis instead of microburst analysis! From the above we see the offending packet is ONLY 3 idles / 3 Bytes from the end of the previous packet. While it is the usual 12B inter frame gap amount, this is still perfectly valid layer 1 40G traffic and not what would be causing the FCS to fail.
The above capture was performed in the FMADIO Lab where we are generating packets using the FMADIO Packet Generation built into every FMADIO Capture Appliance. As such we know exactly what the data payload pattern should be - sequentially incrementing 32 bit integers.

Highlighting Expected data pattern
As we know the expected data pattern, a simple text search highlight shows where the data corruption is. Here we can see above outlined in Red.
To expand on the this, the following is the expected vs what was recorded:
0x9a3e (expected) -> 0x9a2e (captured) where 1 bit is flipped to 1->0and
0x9a3e (expected) -> 0xda3e (captured) where 1 bit is flipped 0-> 1As highlighted in red above, it appears this is a pure data corruption issue. Having some context around what is actually on the wire, and the spacing between packets certainly does help.
Feel free to DOWNLOAD THE TRACE file to get a sense of what can be seen.
Hunting the Packet of Death
And we continue… let’s go down a dungeon level and hunt for a packet of death. In this case a network device would hang or enter an error state with a specific packet, combination of packets, or if something happened on a production network. Nobody really knows what’s happened or why - with the only known information is that the device halts.
In the usual case of finger pointing, the blame game would commence. However we have FMADIO L1 Capture and can drill down directly into the layer 1 stream to fully understand the problem and how to resolve the issue.
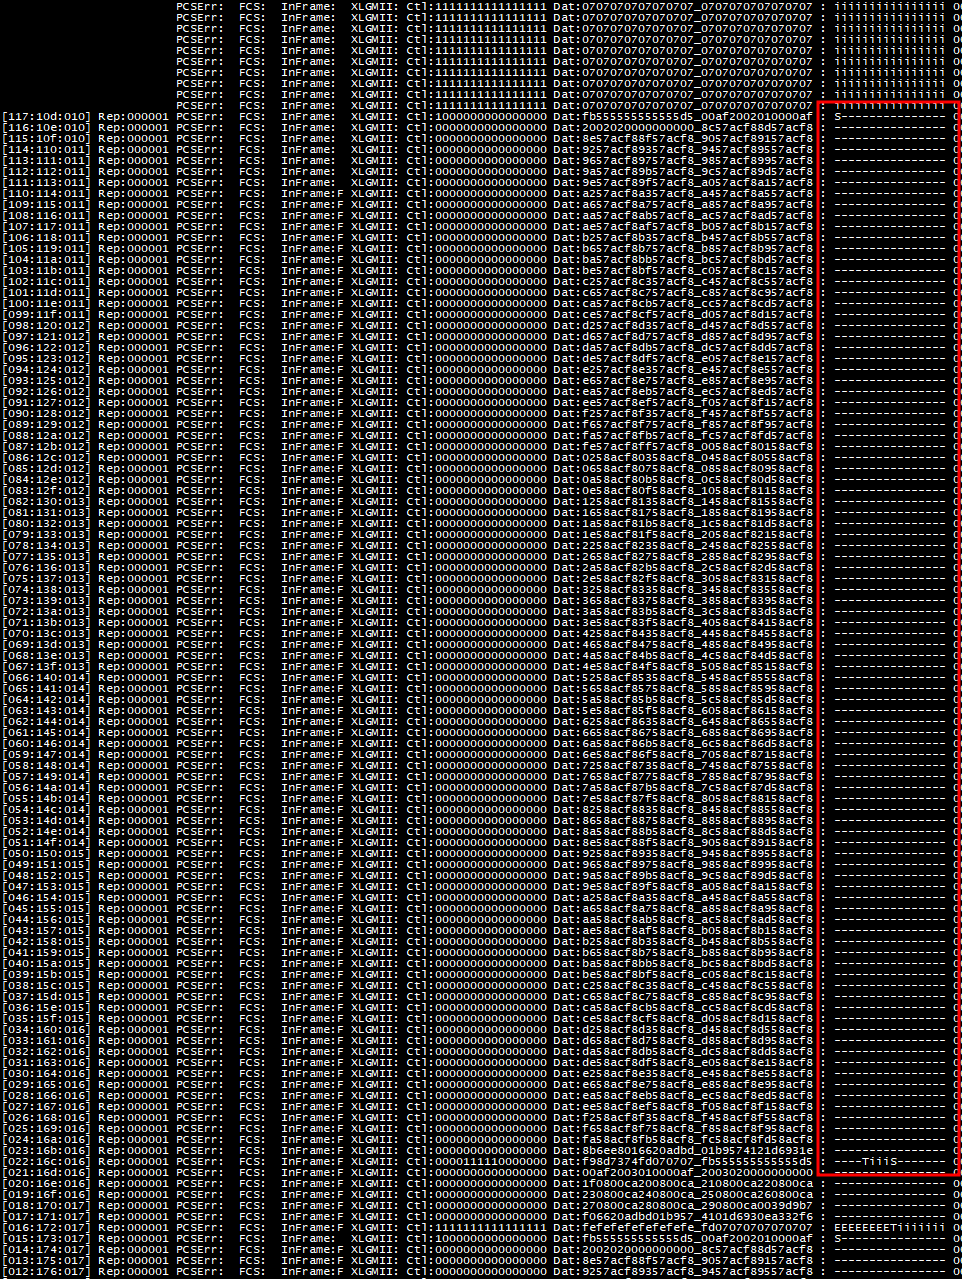
We noticed FCS counters increment slowly and seem to correlate with the device failure state. First attempt is to set FMADIO L1 Capture to trigger on a FCS error. When we do this the following trace below is seen.

What we see here is really interesting. Let’s break it down…
The FCS failure highlighted in red above, is being caused by corruption at the end of the packet. Where FMADIO L1 Capture adds value is that we can see the layer 1 data being received is having issues. It’s no longer a single error counter incrementing, we now have full visibility into why that error counter was increasing.
In layer 1 language a Control Word of 0xFD marks the end of the packet, we also print that in the text trace as a “T” for terminate. As shown below.

End of Packet Problem
What we can see in the FMADIO L1 Capture is that the bytes preceding the end of the Packet are actually a layer 1 Control Word, 0xFE., highlighted in red below.

PCS Packet Of Death
In layer 1 that means “layer 1 has an error”, as in the PCS was unable to decode those specific 8 bits of data. Examples of this would be the link peer sending something incorrectly, or that signal integrity was lost on the wire. The end result is there is no FCS and we don’t really know where the FCS is, resulting in an error counter incrementing.

This particular Packet of Death is highly reproducible and always occurring at the end of the packet. The context of when the issue occurs with respect to the surrounding packets is quite interesting.
There is a burst of very short packets, with a 6 Byte Inter Frame Gap, shown below:

Followed by a reasonably large idle, large in this case is 15 cycles * 128 bits shown below:

Then a large packet, shown below:
And then our problem packet.
One interesting observation is there is only a 3 Byte Inter Frame Gap between the large packet and the Packet of Death, shown in red below. It’s completely valid XLGMII traffic, yet this kind of information can greatly help FPGA or network engineers troubleshoot a problem.

As you can see having FMADIO L1 Capture greatly increases visibility, and time to resolve these kind of weird network errors.
Here is link to DOWNLOAD THE TRACE file, can see the level of detail that’s possible.
Link got you Down
Ever wondered what it looks like when a link bounces at the layer 1 level?
It starts with a ton of Sequence Code words (0x9C), then Error Code words (0xFE) as shown below:

Then more Sequence Code words (0x9C):

Eventually the link gets estabished and its a sea of Idles (0x07):

Auto Negotiation Layer 1 Style
Ever wondered what layer 1 Auto-negotiation looks like? You can see the XGMII Sequence code words a lot, the some errors and then it starts idling

Forget the SOP?
It’s one of those days, staring at the same 1 page of Verilog or VHDL and you just cant get a packet to show up in the capture, NIC or switch. Did you forget the SOP? How would you even know if the SOP was missing or miss aligned? SOP or SOF as in Start of Packet / Start of Frame or in layer 1 speak its 0xFB555555_555555D5 shown in the control word below:

The FMADIO L1 Capture logic can trigger on SOP, EOP and generic “frame error” like conditions such as miss-matched SOP/EOP combinations. In this case we forgot to include the SOP code word when generating packets, it results in a trace looking like the following:

In the above we see there is an Error Code at the start of the packet. As the PCS is confused on what should be there thus outputs a layer 1 error. These type of debug tools can be very helpful when writing low level HDL code.
Triggers
The logic can trigger on a SOP with an incorrect lane alignment, PCS Error Codes, undefined PCS code words and a number of other checks. A list of trigger conditions are shown below:
Layer 1 Trigger Conditions
trigger_runt - Trigger when a runt / under 64B packet is received.
trigger_over - Trigger when an oversized / greater than 9KB JUMBO frame is received. This also doubles as missing EOP/EOF trigger.
trigger_sanitize - Trigger when the sanitizer finds some unknown condition. e.g. misaligned SOF/EOP/Control bits.
trigger_frame - Trigger when a frame is unable to be detected. missing SOP or EOP.
trigger_pcserr - Trigger when PCS Control Word 0xFE is seen anywhere in the layer 1 stream.
trigger_pcsother - Trigger when a PCS Control Word other than 0xFE(Err), 0xFB(Start), 0xFD(Terminate) is seen.
trigger_pcssop - Trigger when a SOP/SOF is received.
trigger_pcssop err - Trigger when a SOP is received in an invalid byte lane.
trigger_pcseop - Trigger when an EOP is received.
CLI Interface
The trace logic is really simple to use, add what kind of layer 1 error you want trigger on, then let it run:
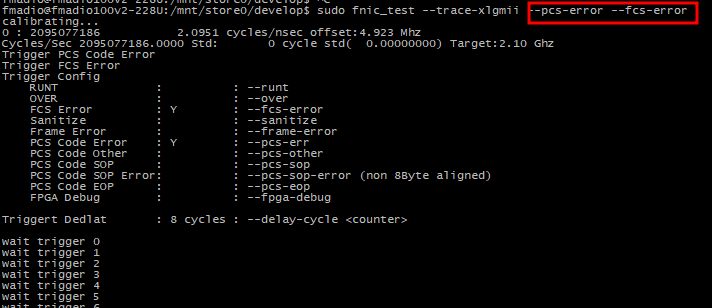
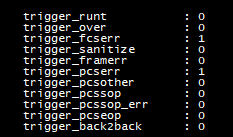
When it does trigger you can see what caused it at the end of the run. In the example below its PCS Error Code (0xFE)

Try it out
FMADIO Layer 1 Capture debugger gives you visibility on the full stream of bits and bytes that few products can provide.
Contact us for a demo of the FMADIO L1 Capture solution.